The Kent Economy and Household Income
Simply Clicks is based in Kent. We also have a number of clients based in Kent. Our economic knowledge and years of experience serving Kent clients have taught us that the geography of Kent has major implications for the success of any Kent-focused SEO or Kent-focused PPC marketing activity. The specific implication depends on the nature of the product or service and its market structure. However, one overriding feature of the Kent economy is how household income changes as you move away from London. The parts of Kent closest to the centre of London tend to be more affluent. Conversely, locations further away tend to be less affluent. This “distance” can be measured in miles or commute time. For example, if you look at the table below, you will notice the position of Ashford. Ashford is further from London but ranks above Gravesham and Medway. The reason being the effect of Ashford’s high speed rail connection.
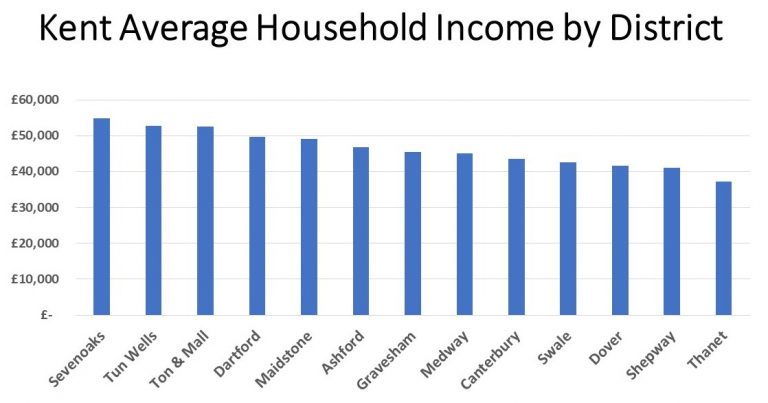
A More affluent northwest Kent a less affluent south and east Kent
Anyone with a cursory knowledge of Kent geography will realise that by looking at the chart above that the places nearest to London tend to occupy the upper end of the income scales and those places further away, tend to occupy the lower end.
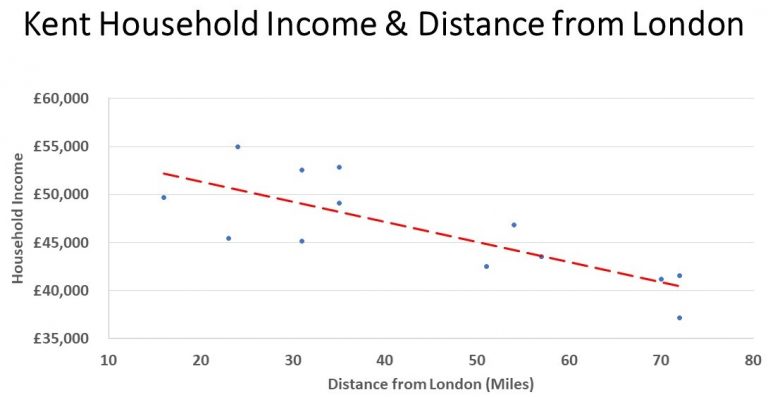
The chart below shows this relationship on the basis of miles from central London. The data being taken from Google Maps. Each district is plotted on two axes. The Y axis showing average household income and the X axis showing distance from London. A red dotted line shows a line of best fit, which correlates at 80% with the distance.
Attractiveness
There is some variation, with certain districts appearing above this line and others below. Towns shown above the line of best fit have positive attractiveness. Excluding the effect of rail commute times, there must be another factor at play. My own view, is that this variation is caused by the relative attractiveness of the towns involved. Towns above the line of best fit have positive attractiveness. Towns below the line, have negative attractiveness. Attractive towns, such as Tunbridge Wells, may attract higher income families. Whilst less attractive towns may well deter them. Attractiveness could be determined by the reputation of schools, the type of shops or access to recreational faclities. In monetary terms, what counts as “attractive” is determined by current and potential residents of each town.
Implications of Household Incomes
This variation in household income presents implications for marketers. If you are marketing luxury goods, you would typically target the more affluent towns. Likewise, if you had the responsibility for retail store location, you would seek to match your store locations to the socio-demographic and income profile of their catchment.
I have several examples of search marketing projects where tailoring search activity to this model has produced outstanding results. If you would like to discuss, please contact us.